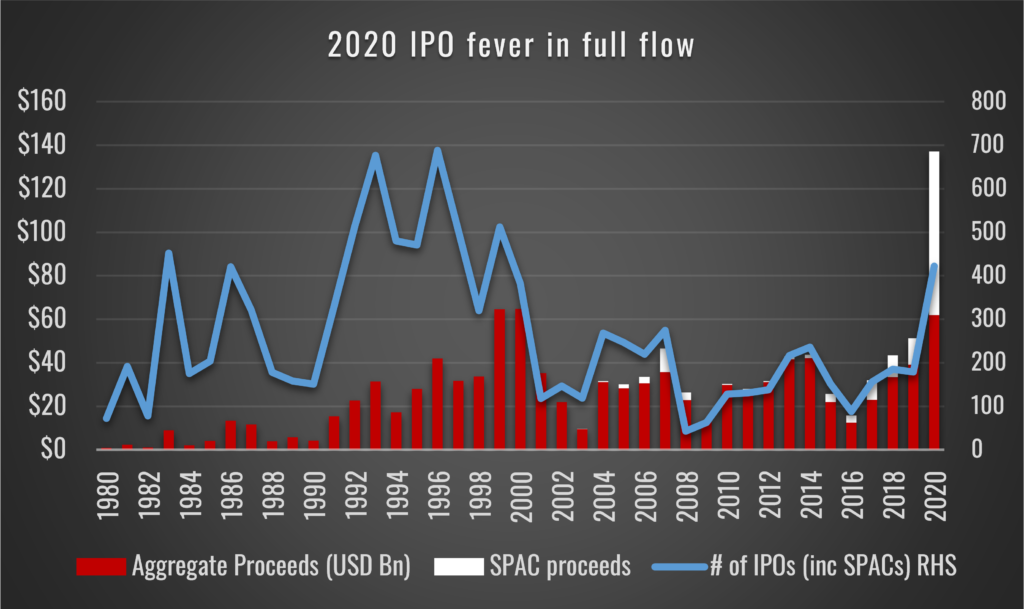
Not since 1999 have IPOs been so hot. In the US, in the last 18 months, the number of IPOs – counting SPACs too – is on par with the heyday of the late 90s. Meanwhile, the issuance proceeds from operating companies (ie not SPACs) matches the previous peak set in 1999 of $65bn for 2020. Including SPACs, it smashes that record with $145bn. Perhaps more importantly for the narrative, and investor enthusiasm, first day gains for IPOs currently average 40.5% (according to Dealogic), a level previously seen in the late 90s heyday. The snippet below is from a Forbes article and neatly sums up the current state of play…
“To say that Initial public offerings (IPOs) have caught the investor community’s imagination would be an understatement. The triple digit first-day gains and an unbridled demand for Internet-related stocks have led the IPO market to new highs. According to Newark, N.J.-based Securities Data Company, IPO activity (year to date) has topped $50 billion, of which more than $26 billion in IPOs has been information technology related.”
Forbes article fromJune 2021November 1999
Actually, this article was written in November 1999 but it may as well have been June 2021. Here is a more recent Reuters version: U.S. IPOs hit annual record in less than six months.
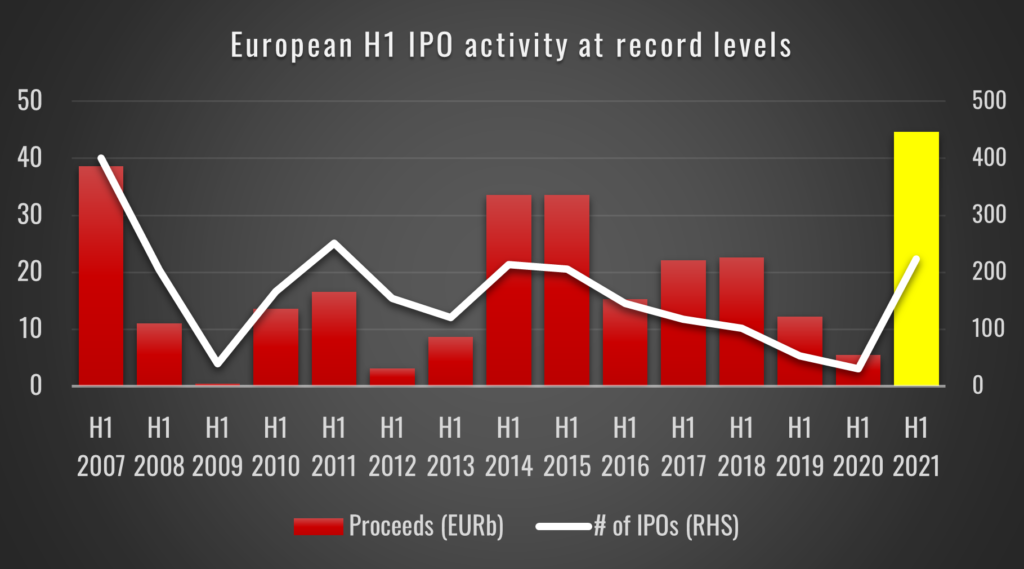
The sound waves from this American IPO-fest have unsurprisingly reverberated across the Atlantic and reached the shores of Europe, which has experienced the largest half year of IPO proceeds raised in over a decade and, if annualised, would also match levels last seen in 1999. In terms of the number of unique IPOs, it would be the largest on record. Below we look at the data for just H1 2021 from PWC’s IPO Watch series.
The question investors need to ask themselves is whether this party is on its last legs, in a similar manner to the final raucous scenes from the infamous night out in The Hangover. Will those IPO investors find themselves waking up, face down on the floor, a tooth missing and Mike Tyson’s tiger purring in the bathroom? … for those with active short books they will be wondering if they are the tiger …

SIGNS OF EXUBERRANCE
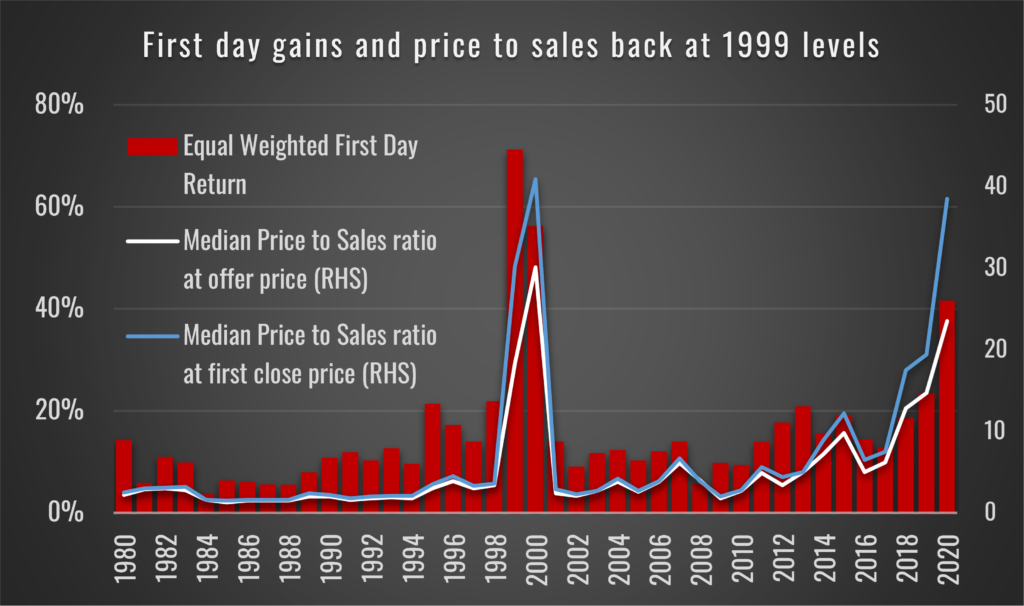
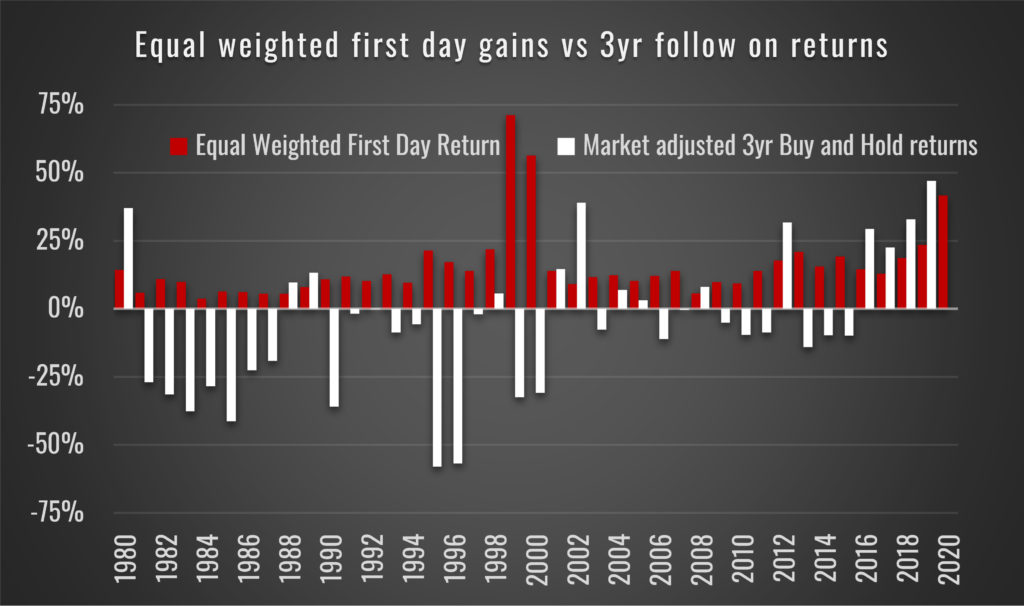
As alluded to earlier, one of the most notable elements to the recent IPO activity is the first day gains being made. To some degree this has started to falter in Europe, (which we analyse in more depth later on), however looking at US data over a longer time period, the chart below gives some historical context and while it ends at 2020, this trajectory has continued in 2021. Furthermore, the median price-to-sales ratio at the offer price isn’t far from the levels recorded during the peak excitement in 1999/2000 and matches it for the first close price to sales.
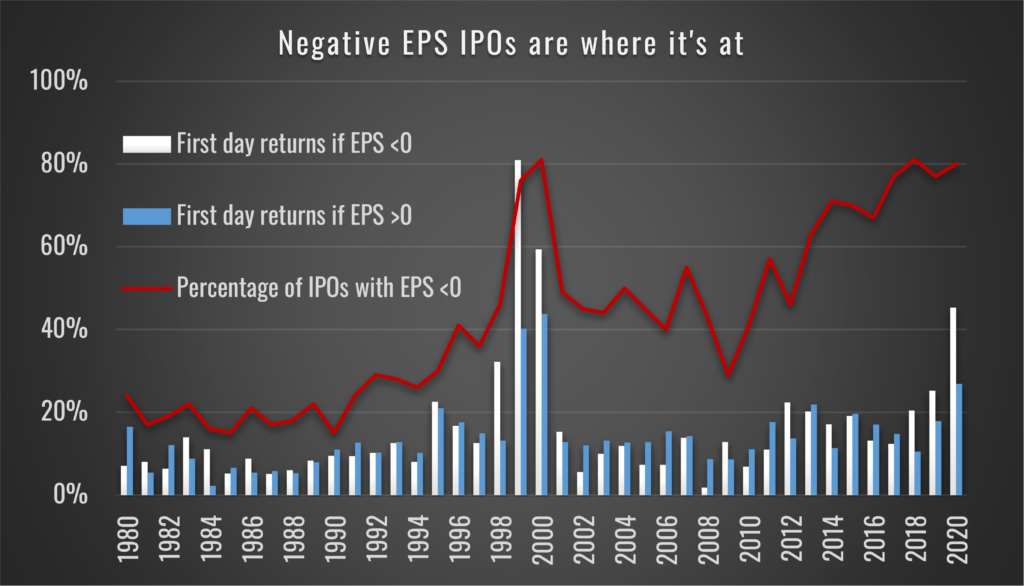
Using IPO data from the University of Florida’s Warrington School of Business, which has a comprehensive databank for the US of more than 8,000 IPOs, we can pull out further detail. For instance, the number of IPOs with negative EPS has reached similar levels to 1999, equally the first day gains made for those loss-making IPOs has far out-stripped those with positive EPS.
Investors looking at these charts should be taking note.. Even here in the more traditionally conservative UK market, of the 20 companies that listed in Q1 2021, 13 outperformed the index in that quarter delivering an average gain of 21% vs the FTSE all share. For us, there is something of a cautionary tale the strength of the gains being made.
A POOR TRACK RECORD
For a start, the track record of beating the market by buying IPOs for the long-term, using our US dataset, is not something to shout about. Whilst the average first day gain is 17.9% from 1980 to 2019, the 3-year buy and hold return from the offer price averages just 42.3% or 2.1% outperformance when taking into account market returns. If you are late to the party, then the story is worse; from the first close price the 3-year buy and hold returns a mere 24.4% or a -15.8% underperformance relative to the market. If you chose to avoid smaller companies (ie sub $100m of sales) your chances of outperforming the market would improve significantly but this would still only lead to a 2.7% return, and a 5.3% return if you only look at those with sales >$1b.
Consider these pretty sobering long-term statistics on IPOs with at least $100m of sales (data from 1975 to 2015):
- 44% of IPOs deliver NEGATIVE 5-year buy and hold returns from the offer price.
- 47% of IPOs deliver NEGATIVE 5-year buy and hold returns from the first close price.
- 60% of IPOs deliver <8% (ie sub market) CAGR on a 5-year buy and hold basis from the offer.
Indeed, if we plot the 3-year buy and hold returns vs the market, from the first close price and compare it to the median price to sales at first close we can see that, unsurprisingly, only those years that haven’t started at exorbitant valuation levels have gone on to deliver some form of positive return (albeit rarely ahead of the market as we have discussed). 2018 and 2019 are shown differently on the chart due to the fact 3yr buy and hold returns are incomplete.
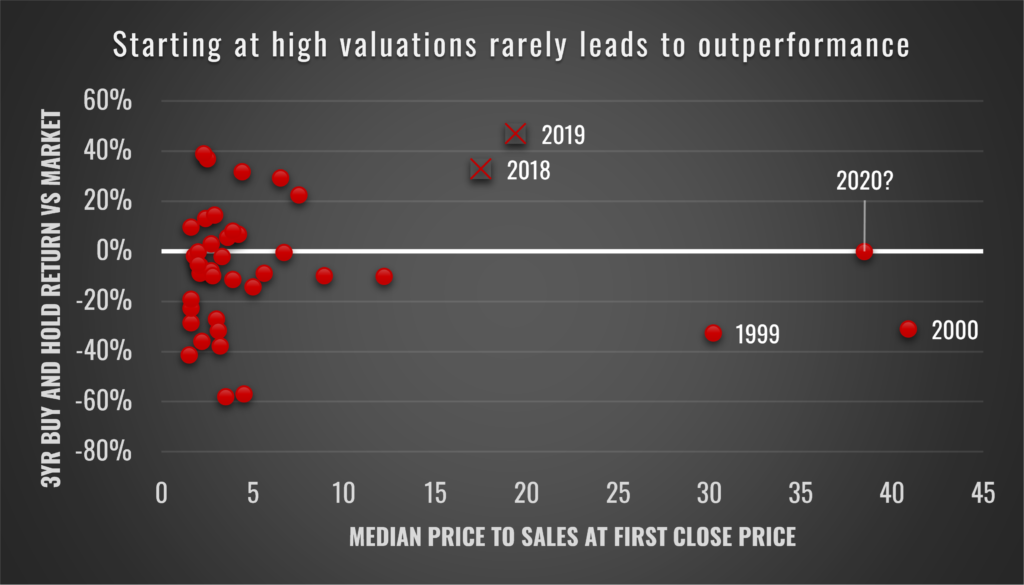
Furthermore, closer inspection of the following 3-year returns shows that it is only due to the market performance in recent years, helped by unlimited FED and ECB liquidity, that has helped shore up the average return metrics for IPOs shown earlier – indeed the outlier nature of 2018 and 2019, still incomplete for full 3 year returns data, is clearly shown in the above figure.
SECONDARY SELLING DOMINATES IN EUROPE
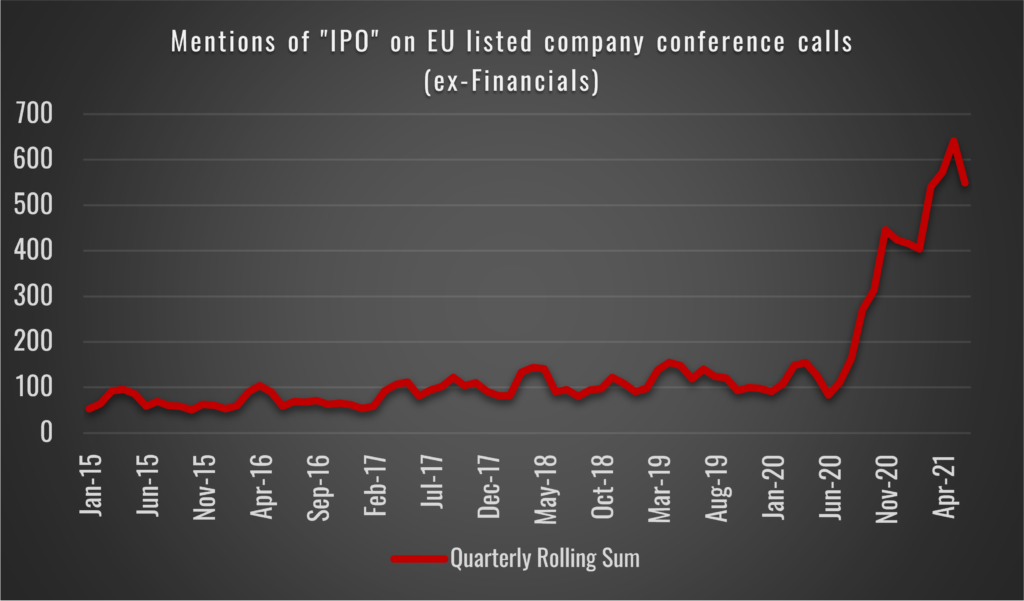
Q1 2021 European IPO issuance has also set records and similarly H1 2021 looks to have set a new high watermark level of IPO issuance. Even well-established listed companies are taking advantage of the IPO fever as this plot of the quarterly rolling mentions of “IPO” on EU conference calls, not including financials, demonstrates. The surge since the middle of 2020 is clear and for further context, we note discussion generally relates to the notion of IPO’ing “undervalued” parts of already listed businesses… one for our event driven clients.
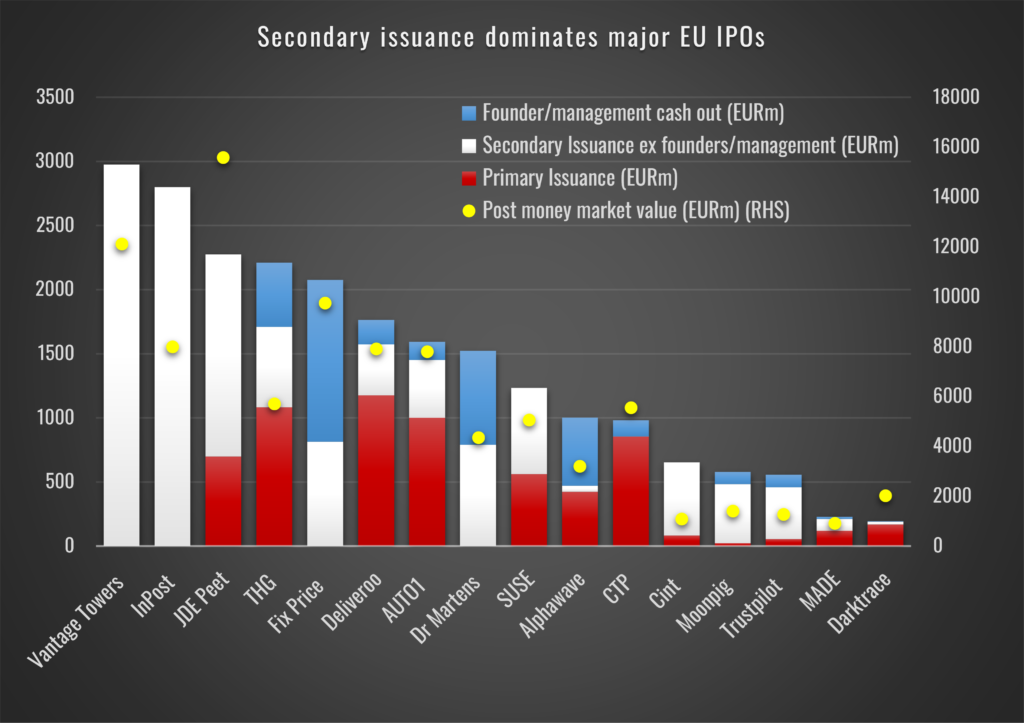
Leveraging Bloomberg’s screening tools, we’ve been able to look under the hood of European IPO issuance with a bit more granularity (we’ve screened for proceeds above €150m – ie just larger IPOs) . What we find interesting is that as opposed to fresh capital being raised for the Issuer, or so-called “new money”, IPO proceeds appear to be heavily weighted towards satisfying cash outs by the owners, generally from founders, VCs or PE firms, otherwise known as “old money”. We refer to this new and old money as Primary and Secondary Issuance, respectively, in the rest of this report.
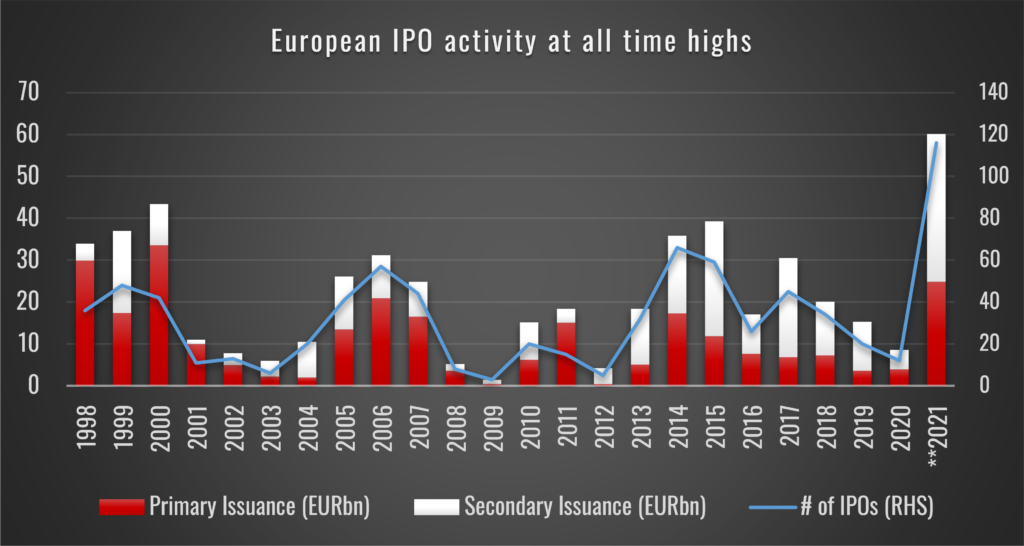
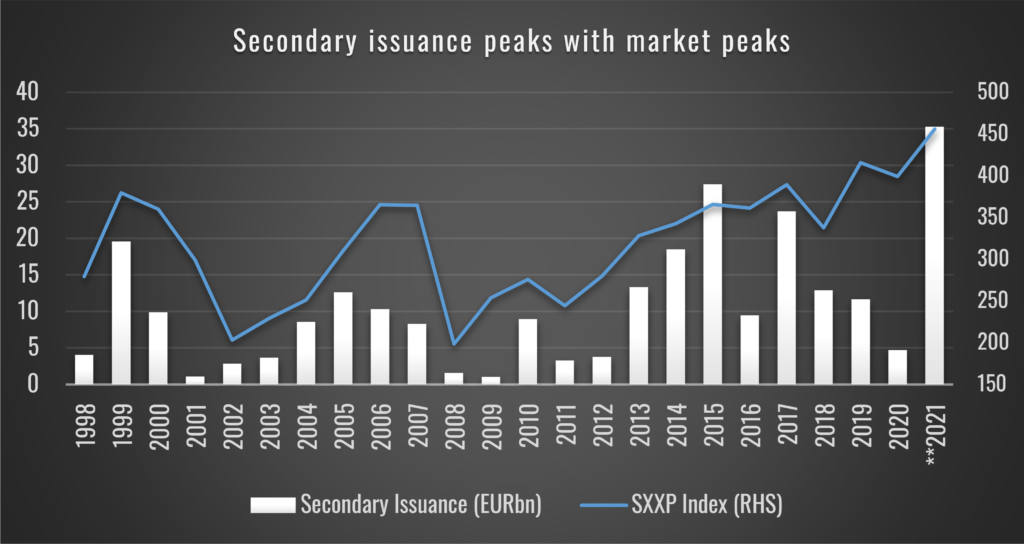
In many cases – as we come onto in more detail later on – enormous wealth has been extracted by these founders even if there is still plenty of “skin in the game” via residual ownership. Such significant capital extraction, at a high point in markets is in our view a very real red flag. It is no coincidence that the peak in IPO proceeds (Primary and Secondary) neatly lines up with peaks in number of IPOs and the performance of the SXXP in the chart below (blue line).
DISSECTING 16 EUROPEAN IPOs
All very interesting, but to identify whether this thematic is actionable, we have looked in detail at 16 of the biggest IPOs across Europe since the start of the year (and included THG and JDE Peet which took place in 2020). Within this opportunity set, we’ve looked with impartiality in order to try and get a better understanding of what specific signals are coming from this IPO glut and whether any stocks stand out and, if so, for what reason. We found the results very insightful…
Published: 12th August, 11:45am
Contact: [email protected]
Terms & Conditions:
ShadowFall Publications Limited’s terms and conditions (collectively, these “Terms”) are available here on the ShadowFall website (www.ShadowFall.com) and set out the basis on which you may make use of the ShadowFall website and its content, whether as a visitor to the ShadowFall website or a registered user. Please read these Terms carefully before you start to use the ShadowFall website.
By using, downloading from, or viewing material on the ShadowFall website you indicate that you accept these Terms and that you agree to abide by them. If you do not agree to these Terms, you must not use the ShadowFall website nor any of its content.
You must not communicate the contents of this website blog entry (“entry”) and other materials on this website to any other person unless that person has agreed to be bound by these Terms. If you access this website, download or receive the contents of website blog entries or other materials on this website as an agent for any other person, you are binding your principal to these same terms.
Disclaimer and Disclosures:
This entry, which contains an implicit recommendation, has been produced by ShadowFall Publications Limited which is an Appointed Representative (FRN 842414) of ShadowFall Capital & Research LLP which is authorised and regulated by the Financial Conduct Authority in the United Kingdom (FRN 782080) (together “ShadowFall”) and published onto the ShadowFall website (www.ShadowFall.com).
Any information which could be construed as investment research has not been prepared in accordance with legal requirements designed to promote the independence of investment research and is also not subject to any prohibition on dealing ahead of the dissemination of investment research. Unless otherwise specified, the information and opinions presented or contained in this entry are provided as of the date of this entry. ShadowFall is under no obligation to update, revise or affirm this entry.
Neither the authors nor ShadowFall are aware of any factor, subject to the paragraph above, which might reasonably be expected to impair their objectivity in the preparation of this entry. The authors and ShadowFall are not aware of any direct or indirect conflicts of interest, subject to the paragraph above, that might exist between the authors or ShadowFall and any issuer which is the subject of this entry (the “issuer”). In particular, neither the author nor ShadowFall has any affiliation with the issuer.
ShadowFall has taken all reasonable steps to ensure that factual information in this entry is true and accurate. However, where such factual information is derived from publicly available sources ShadowFall has relied on the accuracy of those sources.
Some of the open-source data contained in this entry may have been sourced from public records made available by Companies House, which is licensed under the Open Government License; https://www.nationalarchives.gov.uk/doc/open-government-licence/version/3/
All statements of opinion contained in the entry are based on ShadowFall’s own assessment based on information available to it. That information may not be complete or exhaustive. No representation is made, or warranty given as to the accuracy, completeness, achievability or reasonableness of such statements of opinion.
This entry is only intended for investors who qualify as FCA defined Professional Clients (the “Recipient(s)”), who are expected to make their own judgment as to any reliance that they place on the content of the entry. This entry is not suitable for, nor intended for any persons deemed to be a “Retail Client” under the FCA Rules. In addition, the content of this entry is not intended for any jurisdiction outside which ShadowFall is not authorised.
This entry is for informational purposes only and is not an offer or solicitation to buy or sell any investment product. This entry is the property of ShadowFall.
ShadowFall does not take responsibility or accept any liability for any action taken or not taken by the Recipients of this entry as a result of information and/or opinions contained in the entry. Specifically, Recipients of this entry agree to hold harmless ShadowFall and its affiliates and related parties, including, but not limited to any partners, principals, officers, directors, employees, members, clients, investors, consultants and agents (collectively, the “ShadowFall Related Persons”) for any direct or indirect losses (including trading losses) attributable to any information and content on the ShadowFall website including any publications on the website.
In no event shall ShadowFall or any ShadowFall Related Persons be liable for any claims, losses, costs or damages of any kind, including direct, indirect, punitive, exemplary, incidental, special or, consequential damages, arising out of or in any way connected with any information or content on the ShadowFall website or in this entry.
Recipients must exercise their own judgment and where appropriate take their own investment, tax and legal advice prior to taking or not taking action in reliance on the contents of this entry.
Forward-looking information or statements in this entry may contain information that is based on assumptions, forecasts of future results, estimates of amounts not yet determinable, and therefore involve known and unknown risks, uncertainties and other factors which may cause the actual results, performance or achievements of their subject matter to be materially different from current expectations. ShadowFall makes no representation herein that forward-looking predictions shall come to pass. ShadowFall is committed to providing services and products which are unbiased and impartial and have implemented a Conflicts of Interest Policy pursuant to FCA rules.
